A        N        Y        W        H        E        R        E
A        N        Y            T            I           M           E

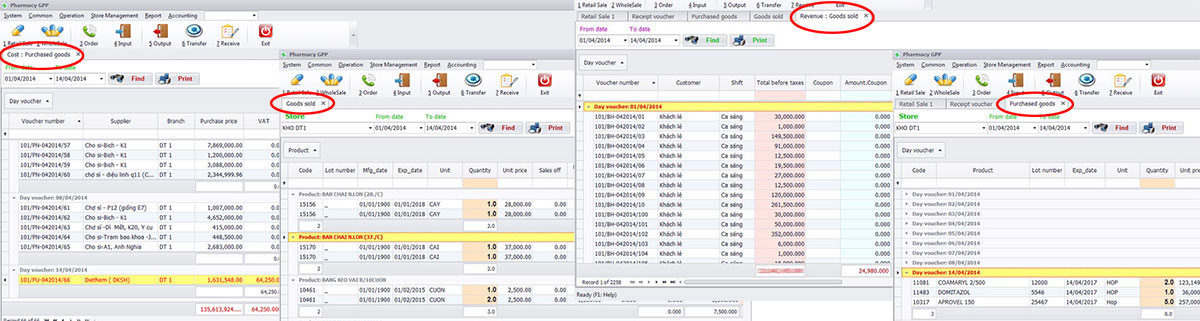
PharmacyGPP – Sales Management Software provides a wide variety of Reports and Analytics. Analyze sales – purchases – transfers by different parameters, such as time, stores, employees, payment types and more.

Key Features of Reports and Analytics

  • Access reports instantly online, which are kept up-to-date in real time.
  • Access your reports from a smartphone, tablet or computer anytime, anywhere.
  • View revenue, average sale and profit.
  • Track sales trends and react to changes promptly.
  • Determine best-selling items and categories.
  • View complete sales – purchases – transfers history.
  • Export data to the spreadsheets.
Access Your Data Anytime Anywhere

References: https://www.suburbantestinglabs.com/news/environmental-lab-testing-online-data-access-05012018.html

Access Reports and Data From Anytime – Anywhere

Business owners can check sales reports from home (or anywhere else), with no need to wait for a manager to run a report and email it over.

REPORTS and ANALYTICS
  • Track your sales across stores: Wherever you are, you can choose to access any store and observe sales, monitor performance, absorb insights and take real time decisions to increase sales and customer satisfaction.
  • With the sales and shift reports, you can see how much profit is made and which employees are making the most sales at specific times in order to better apply resources where necessary to increase business.
  • Track the sales growth or decline compared with the previous day, week, or month, and promptly react to changes.
  • Determine top-selling items and categories, top-performing employee and store with the top sales. And therefore, the right purchasing decisions can be made.
See more about Sales
report filter
  • You can now filter the Product Mix Report by time-ranges to see how your products are selling during specific times, during a day. And find out the difference between expected and actual cash amounts.
  • Increase profit margins by analyzing product performance on specific days or times or day.
  • Determine when certain products sell the best, when they sell the worst, and use this information to streamline your marketing and inventory!
  • Compare sales by different periods, stores, employees, check the important parameters, such as gross sales, net sales, and gross profit, amounts of refunds made and given discounts.
See more about Price List

Inventory Reports

  • With the inventory reports, you can analyze which items are causing you to lose or gain the most money and then adjust your stock accordingly to increase profits.
  • View the Store Transfer Report for info on all items transferred from one store to another during a specified time period.
  • Use the Adjustment Report to view data on all adjustments to items that occurred in a specific time period, as result of them getting lost, broken, stolen, etc.
See more about Inventory Management
Inventory reports

AI-driven analytics *

  • Inventory optimization (calculating optimal inventory levels based on multiple factors, from sales data to weather conditions).
  • Demand forecasting (using historical data to predict lead times by items and calculating an optimal safety stock based on it).
Rate this page

Contents